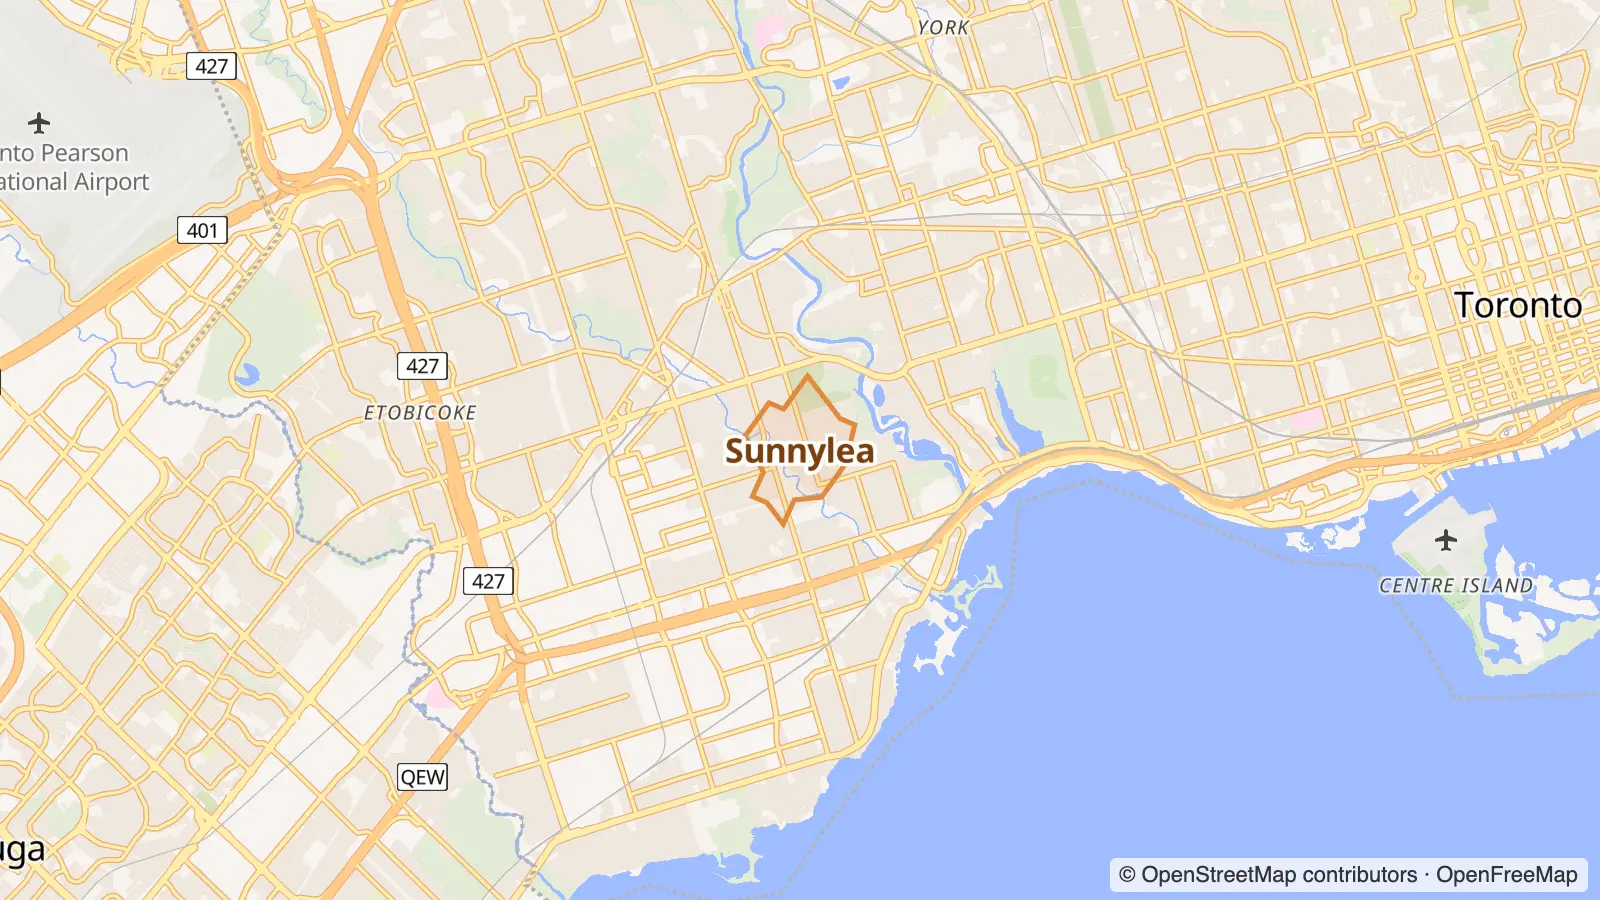
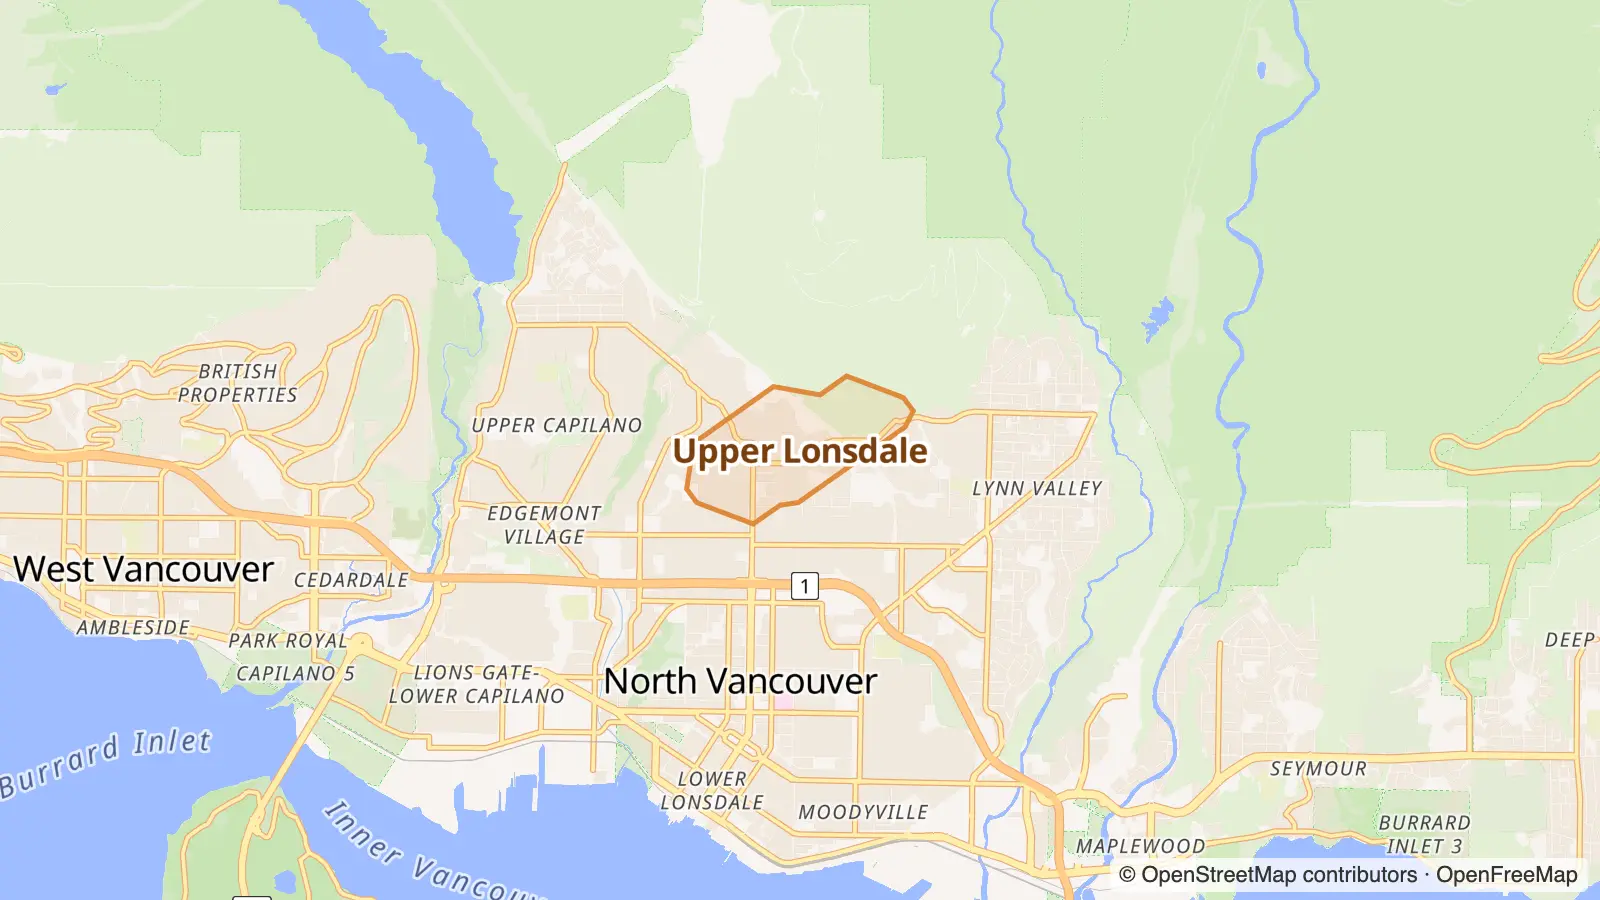
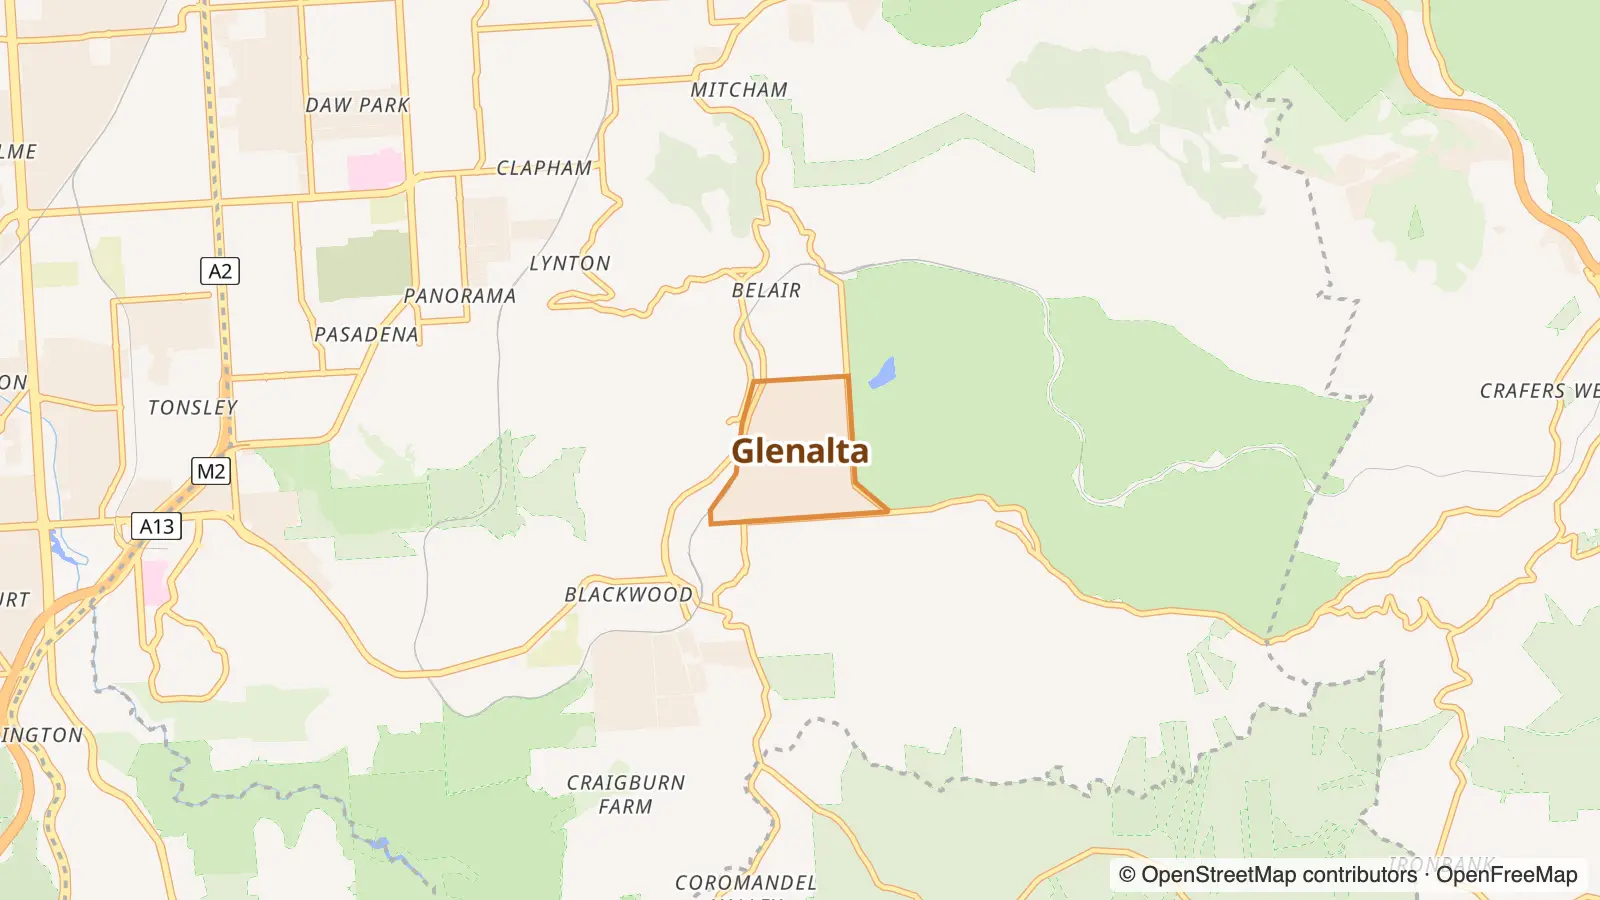
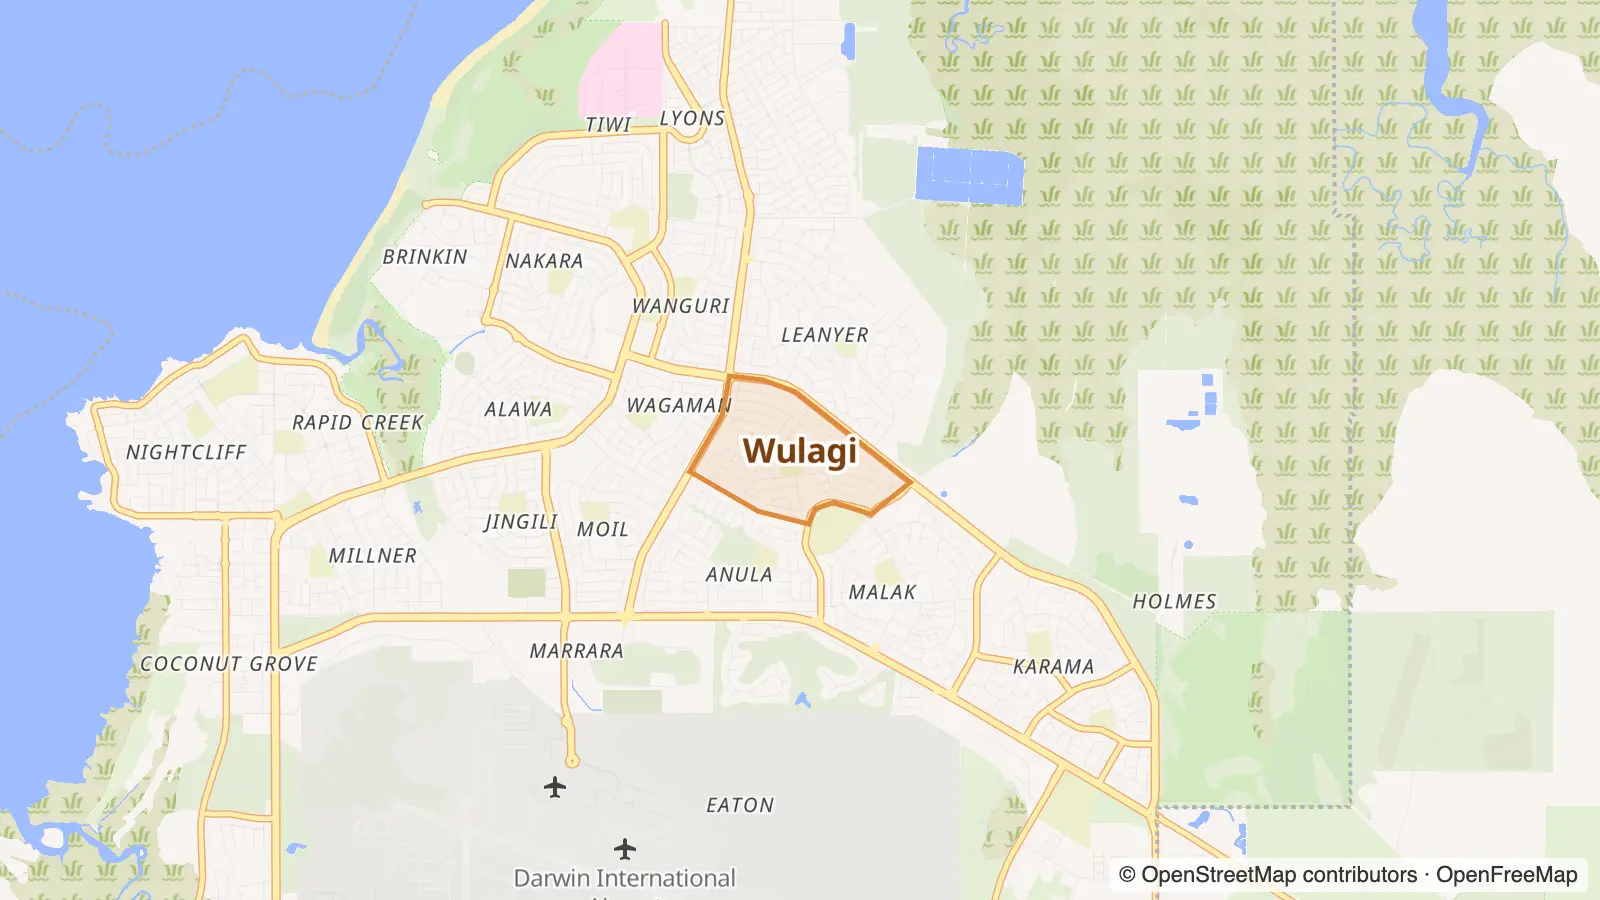
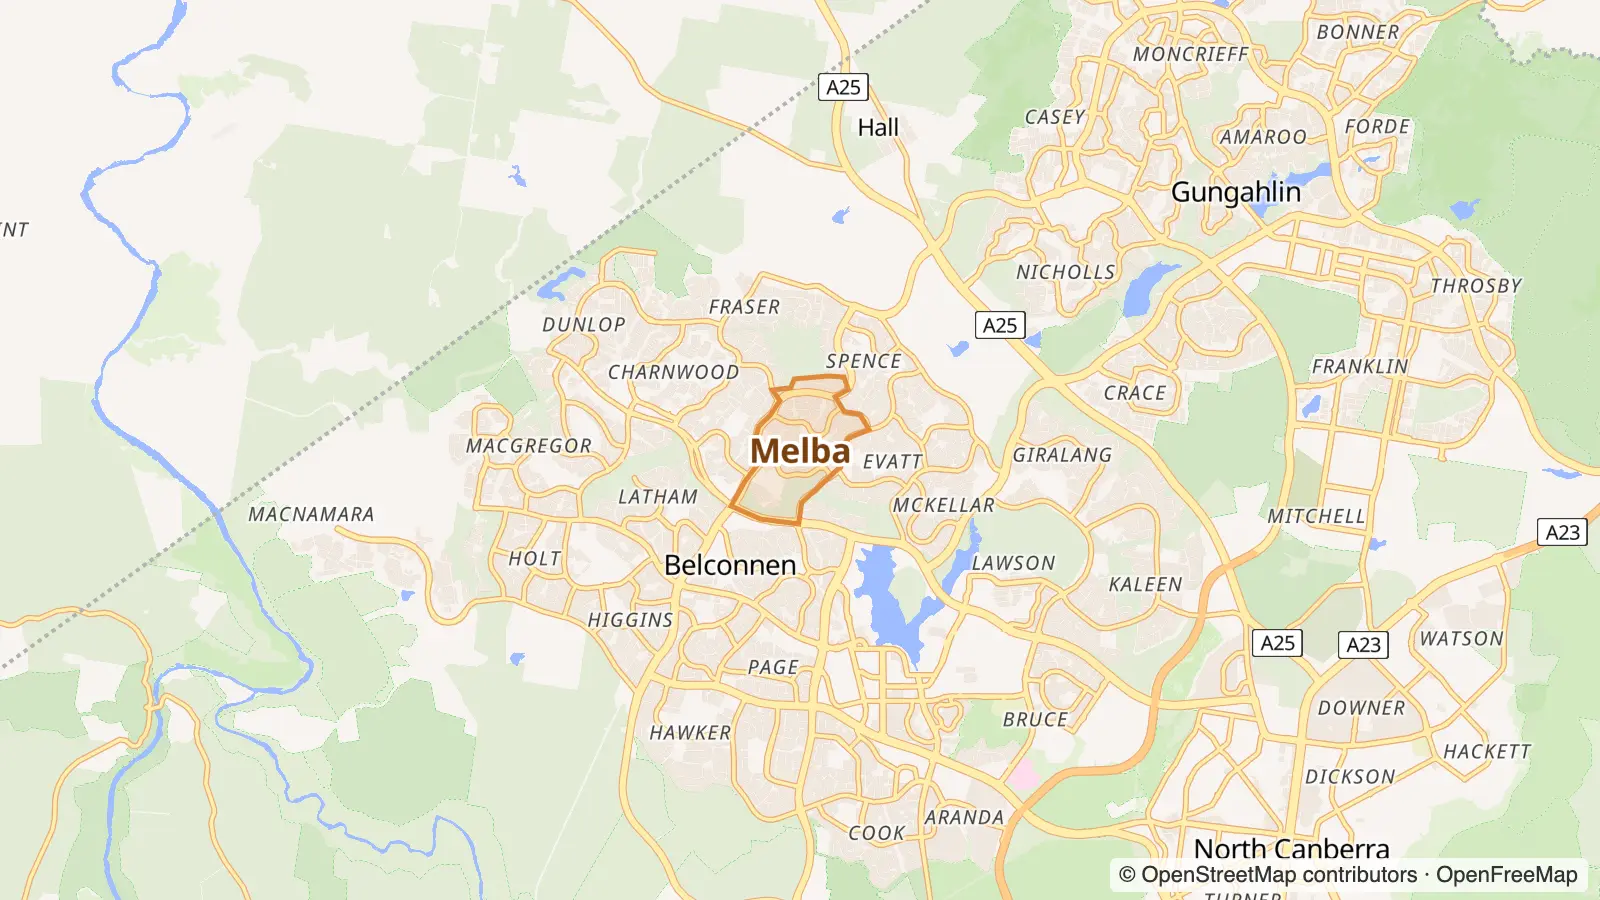
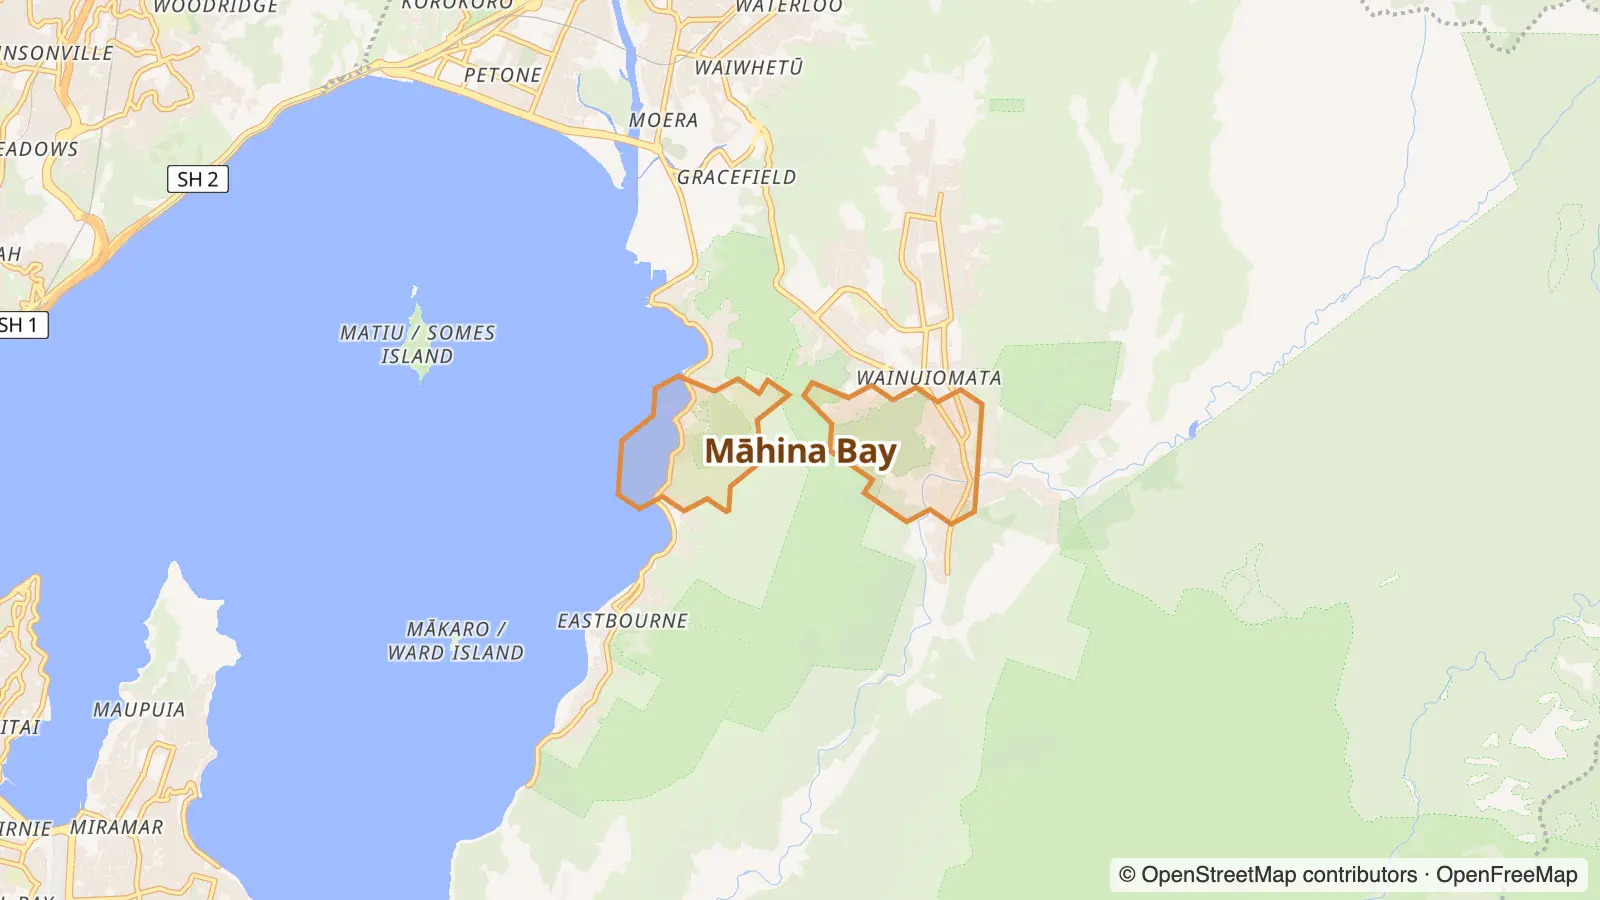
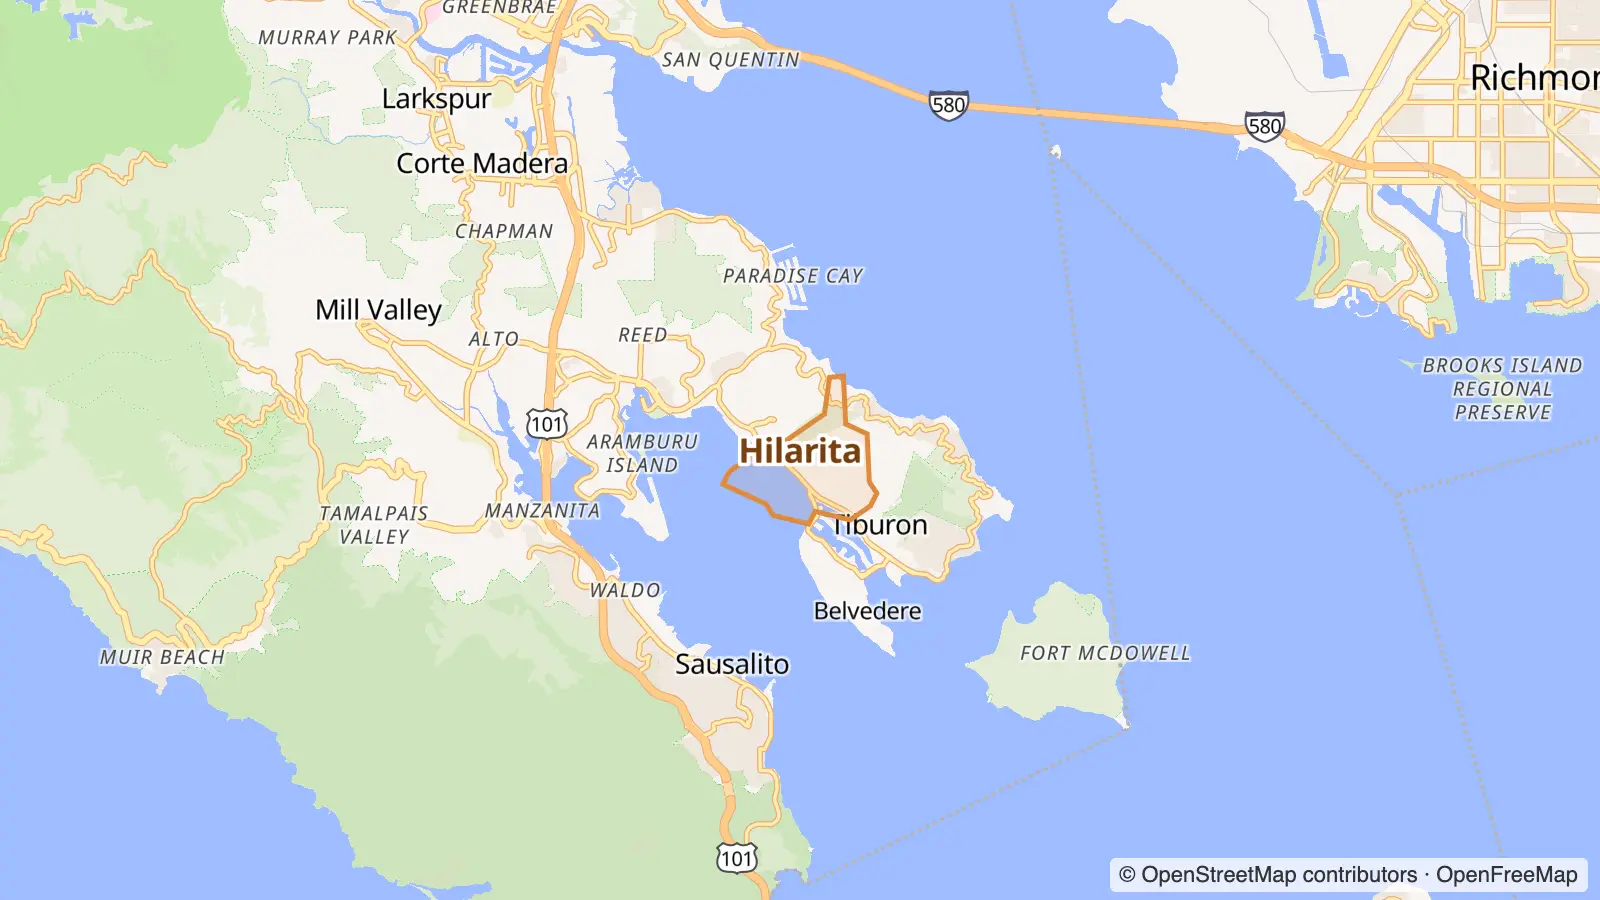
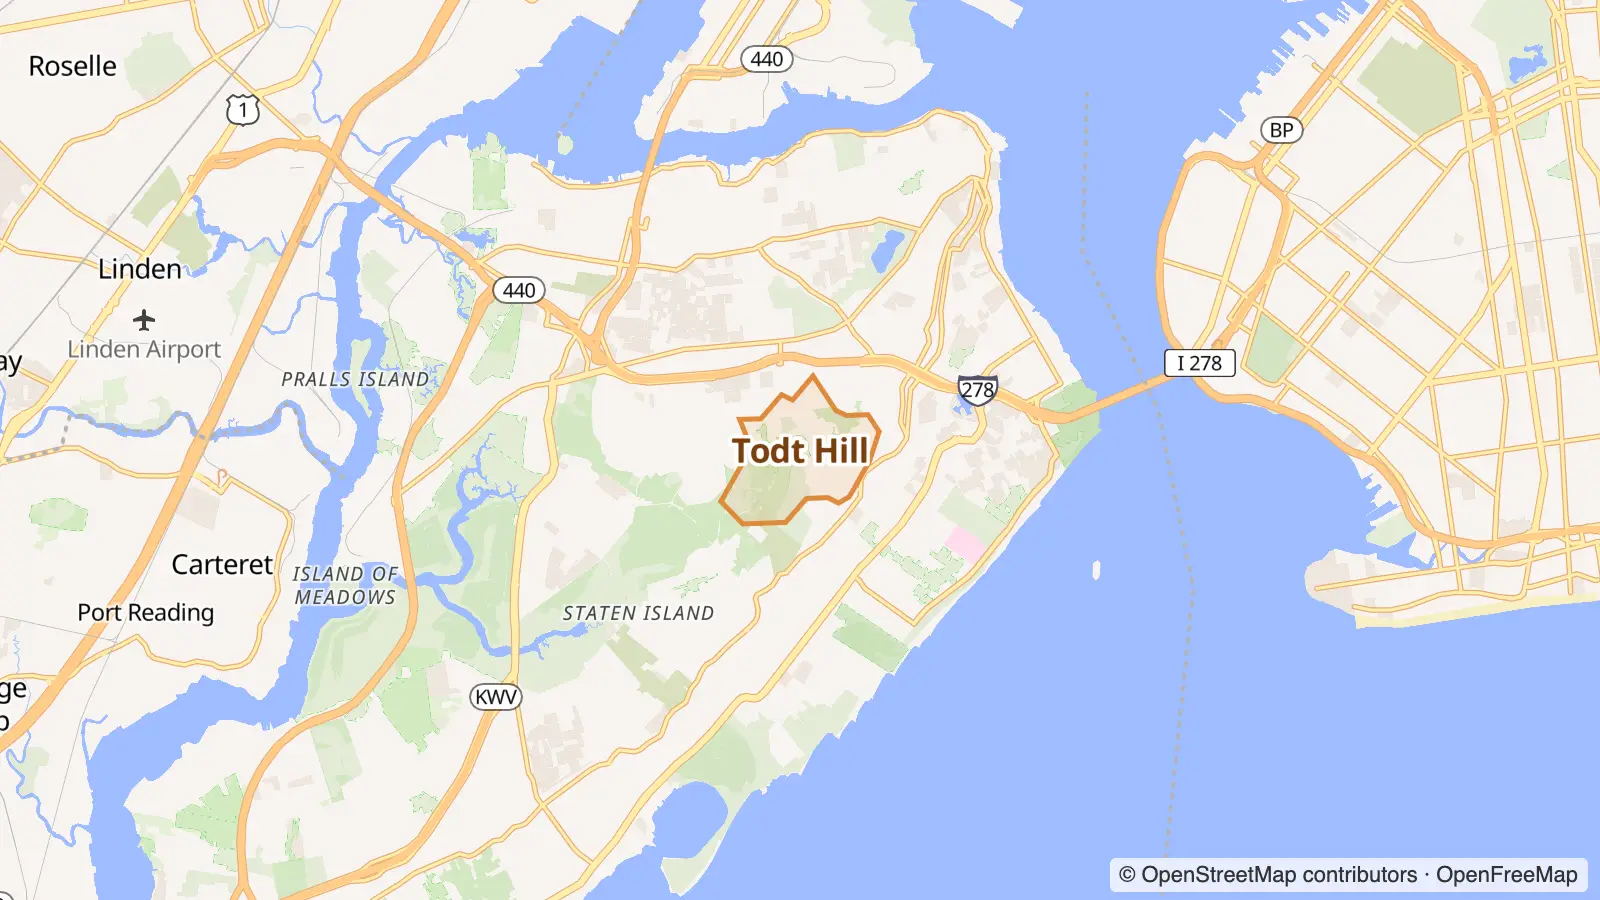
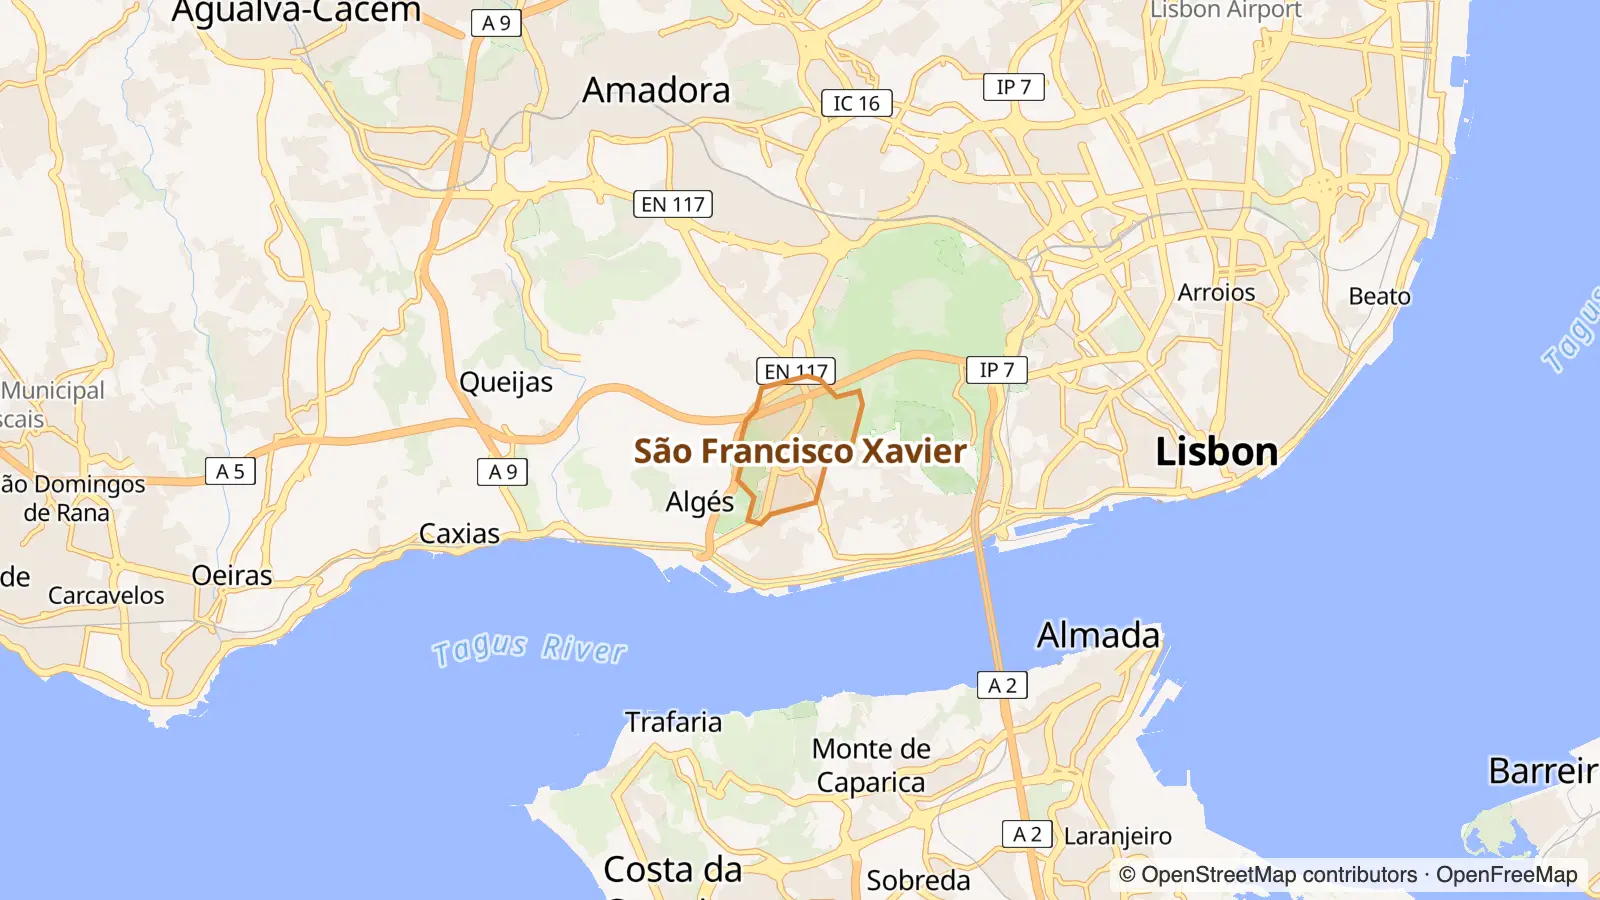
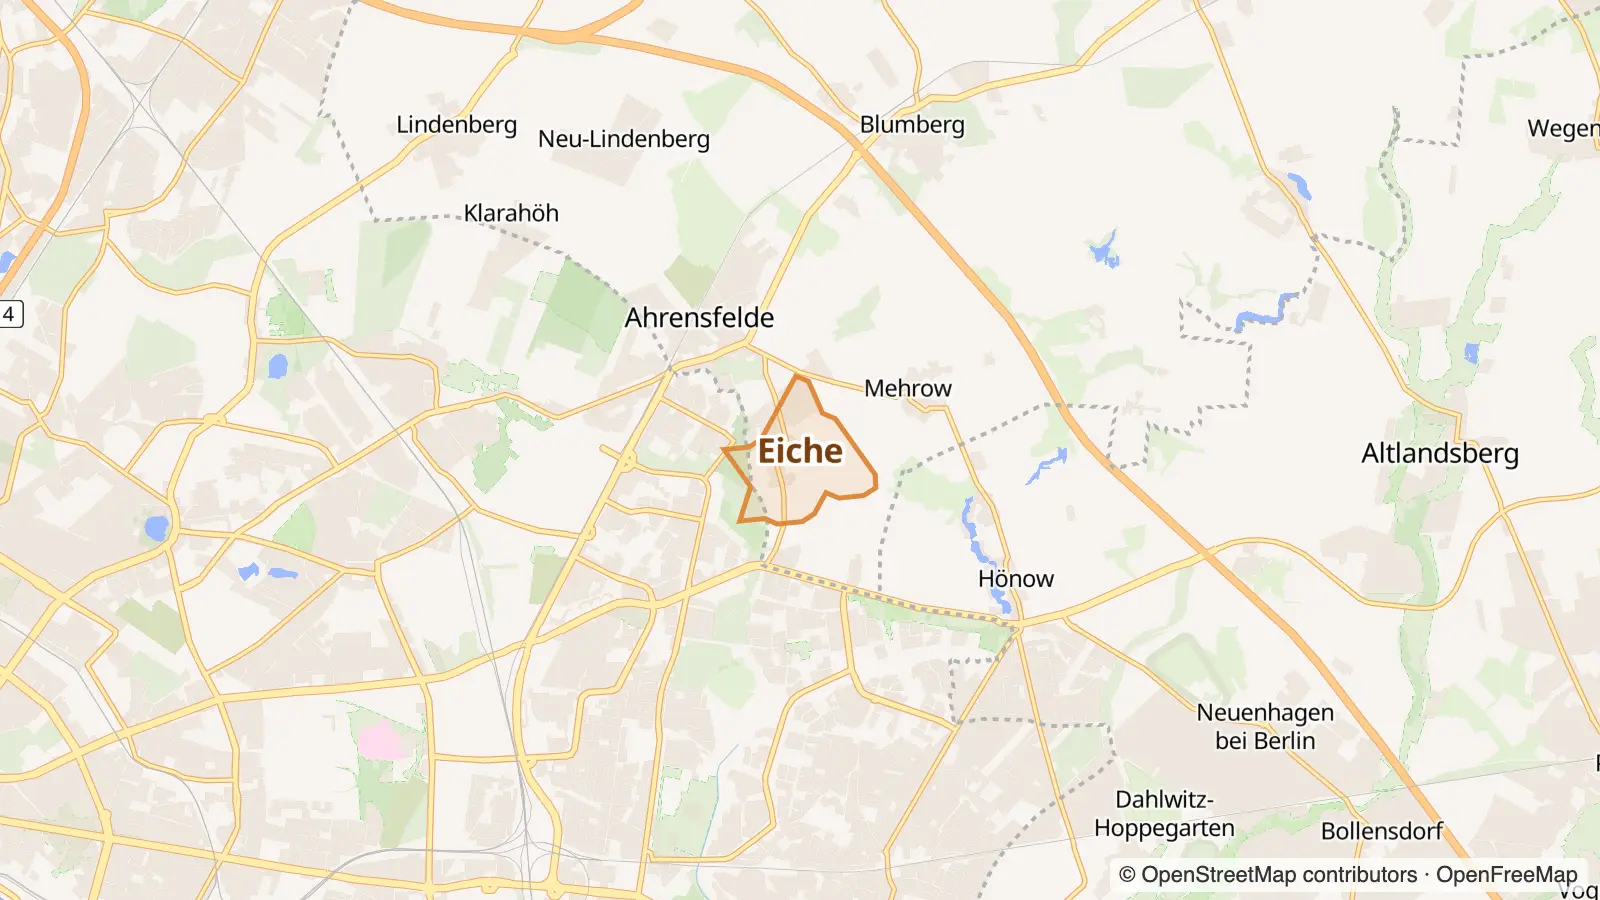
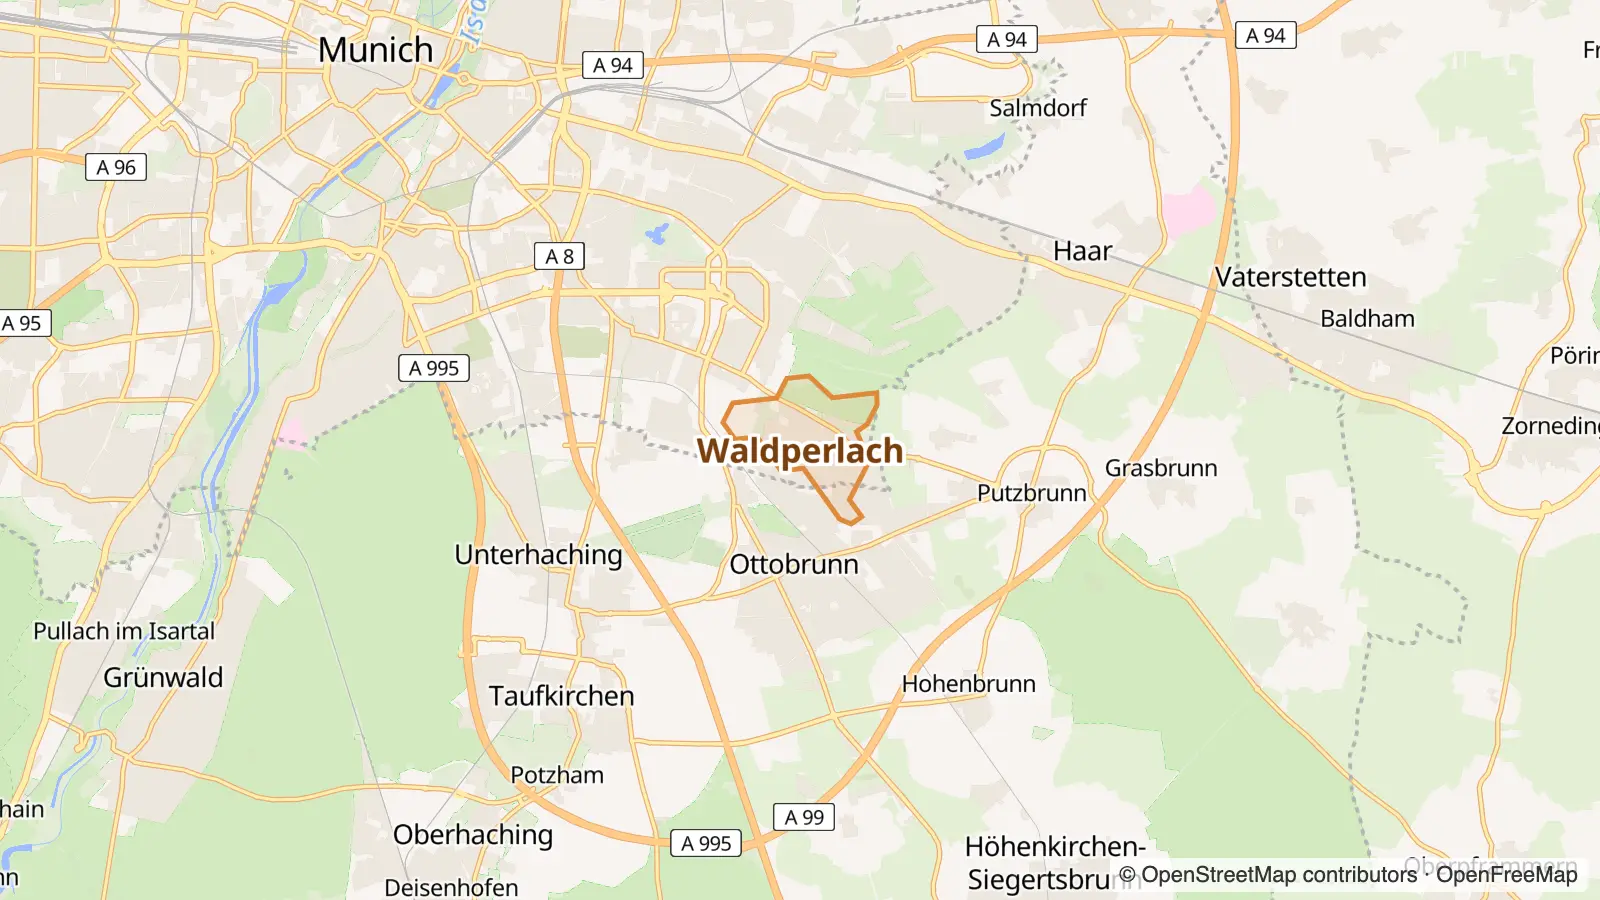
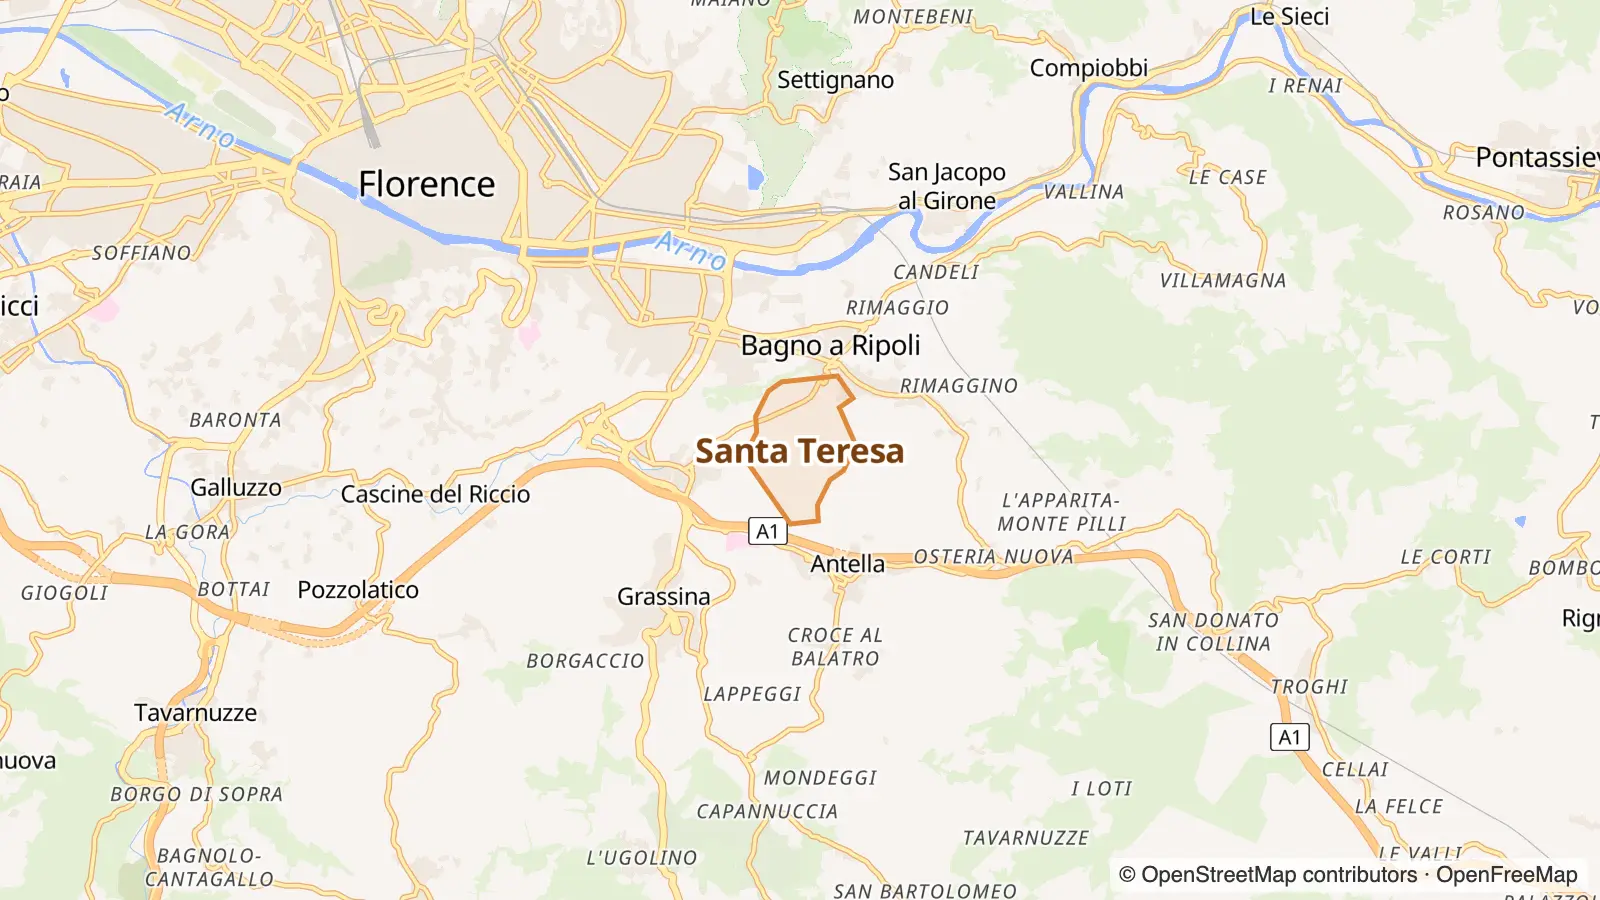
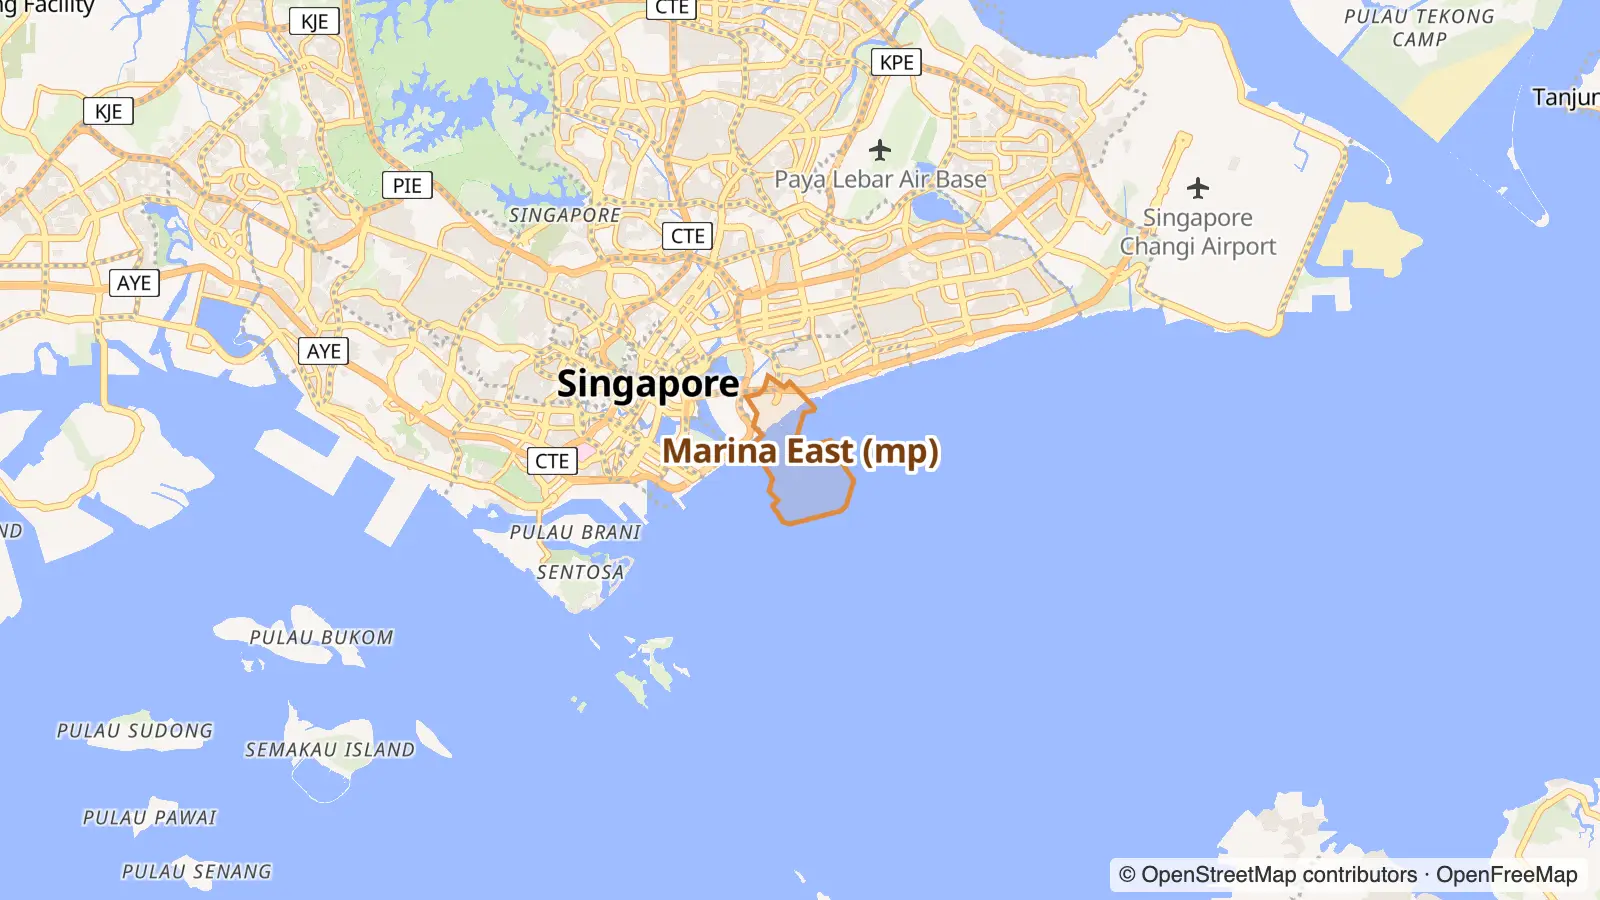
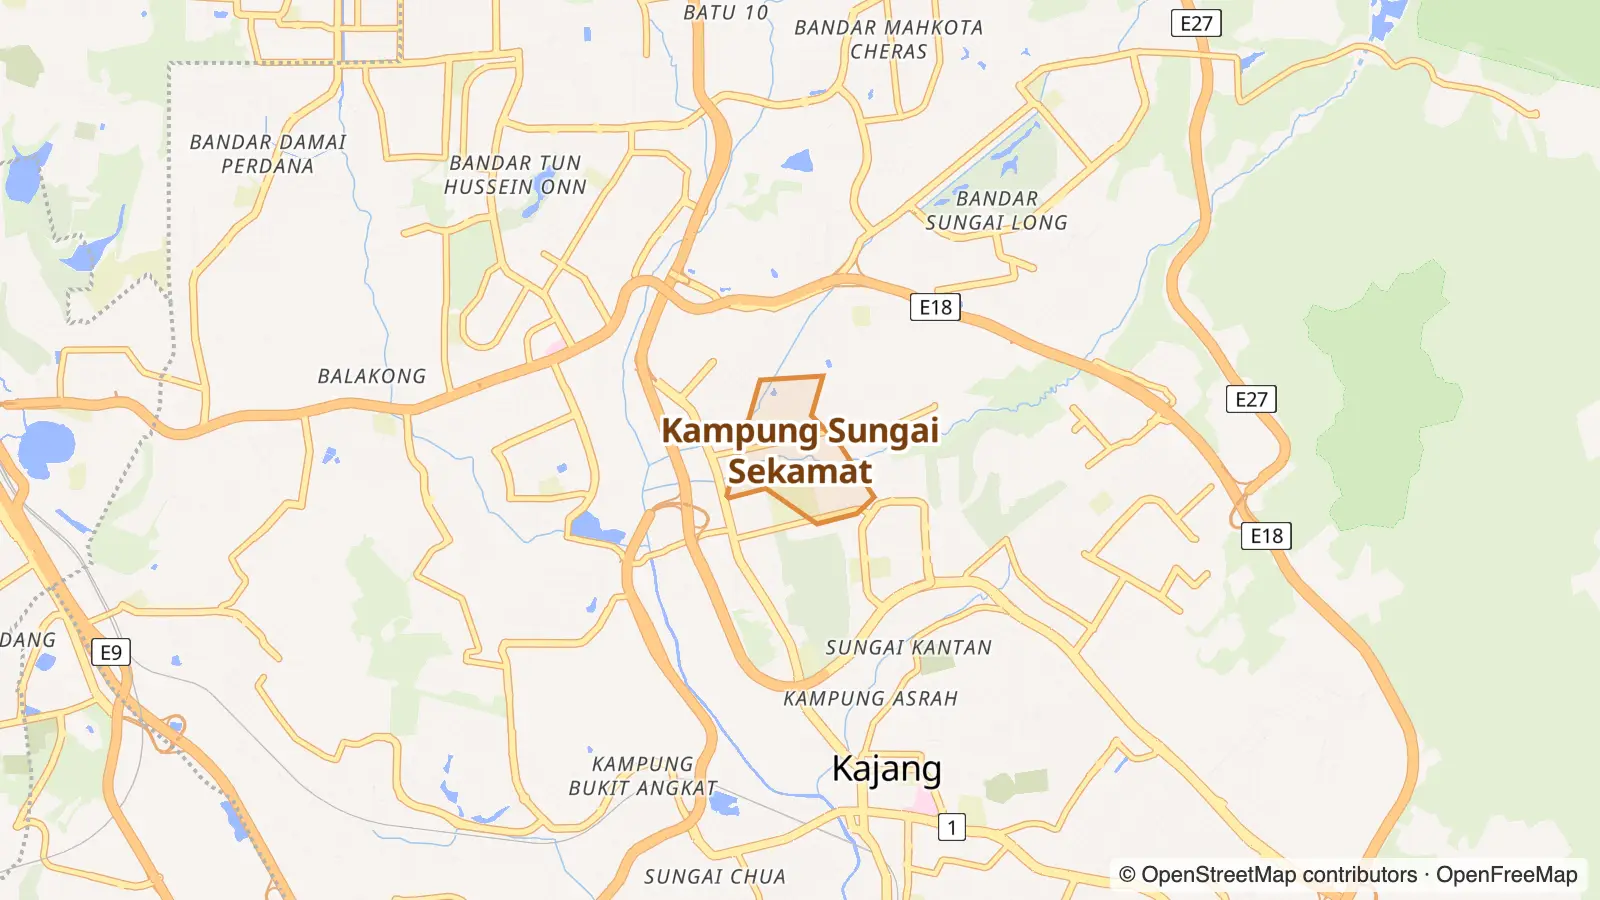
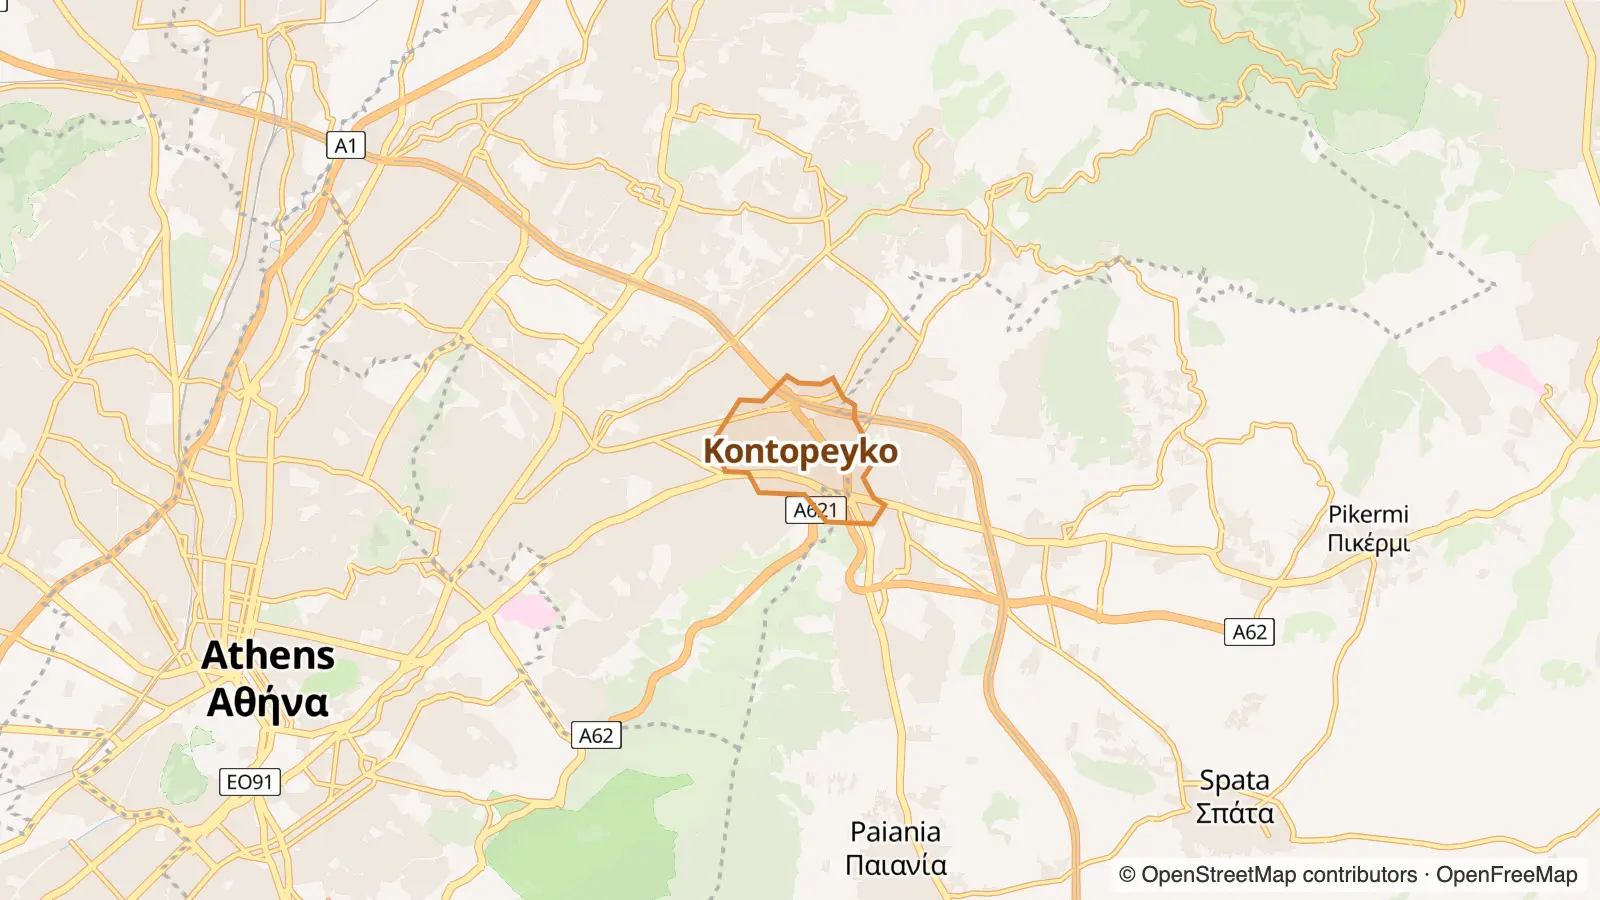
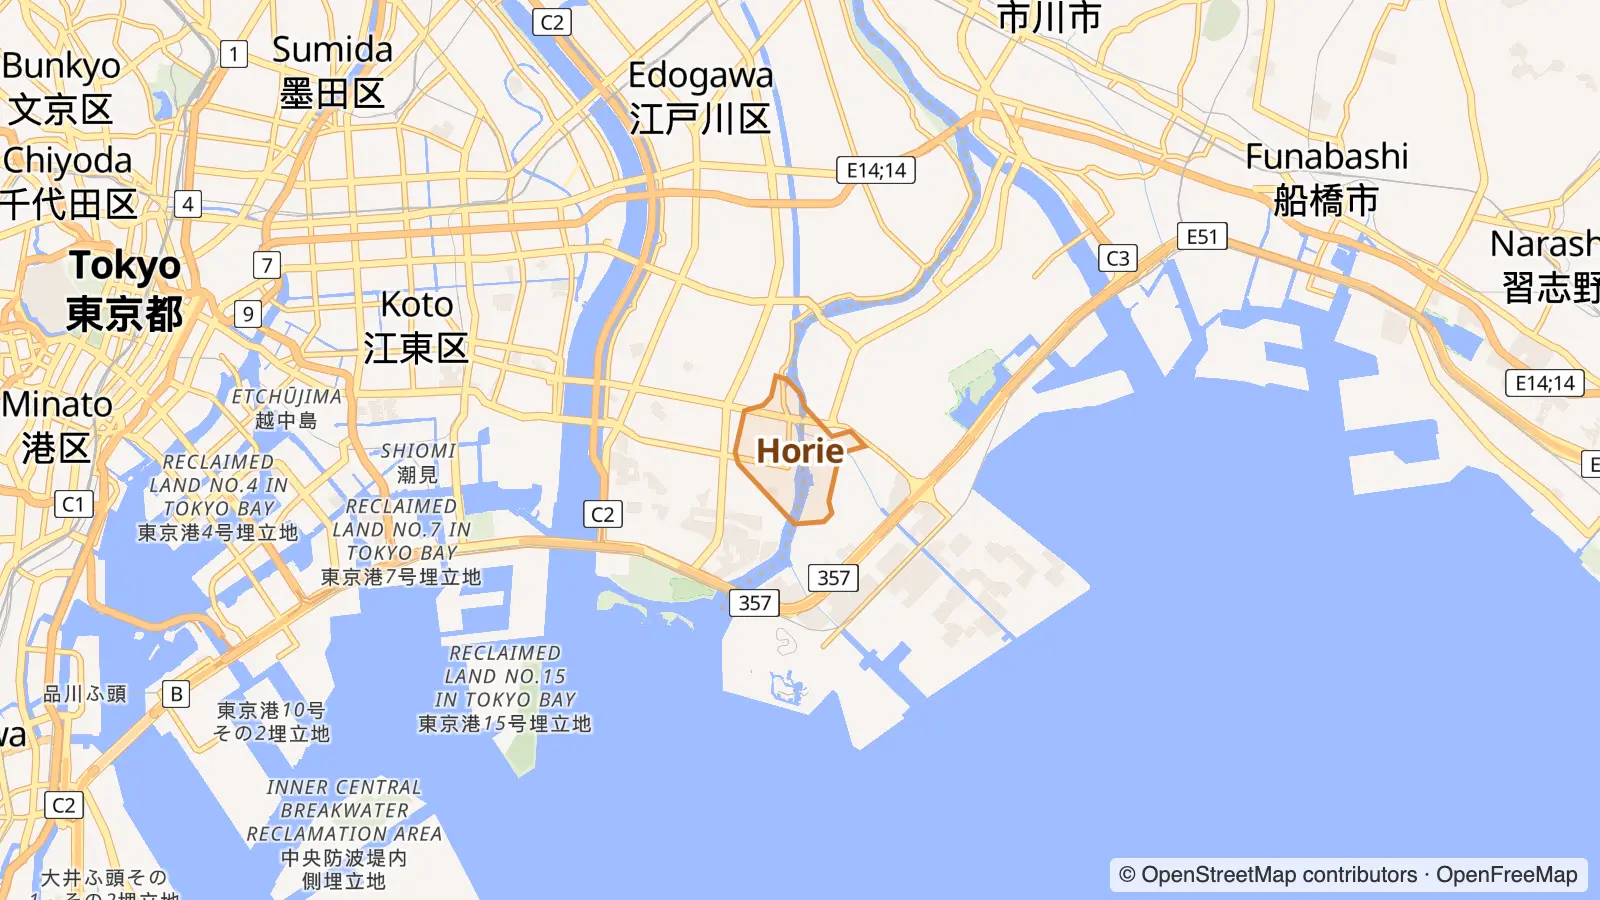
Here's where to look in other cities. We compare where each neighbourhood sits within its own city: how dense, how central, how busy its streets are, the mix of cafés, bars and shops. That way a Hobart suburb can match a London one even though everything else differs.
5,813residents
3,478people / km²
45median age
top 13%for income in Toronto
top 37%for rents in Toronto
20%renting
24%flats & apartments
30%born abroad
9.8 kmto Toronto centre
0.8 kmto a train / metro
29shops, cafés & places
Reading the matches. Each trait shows where Sunnylea ranks in Toronto, then where the match ranks in its own city: “top 5%” means among the 5% of areas that fit the label best. Hover a trait to see which is which.
Know these places? Use 👍 / 👎 to say whether a match feels right. Votes feed into the rankings.
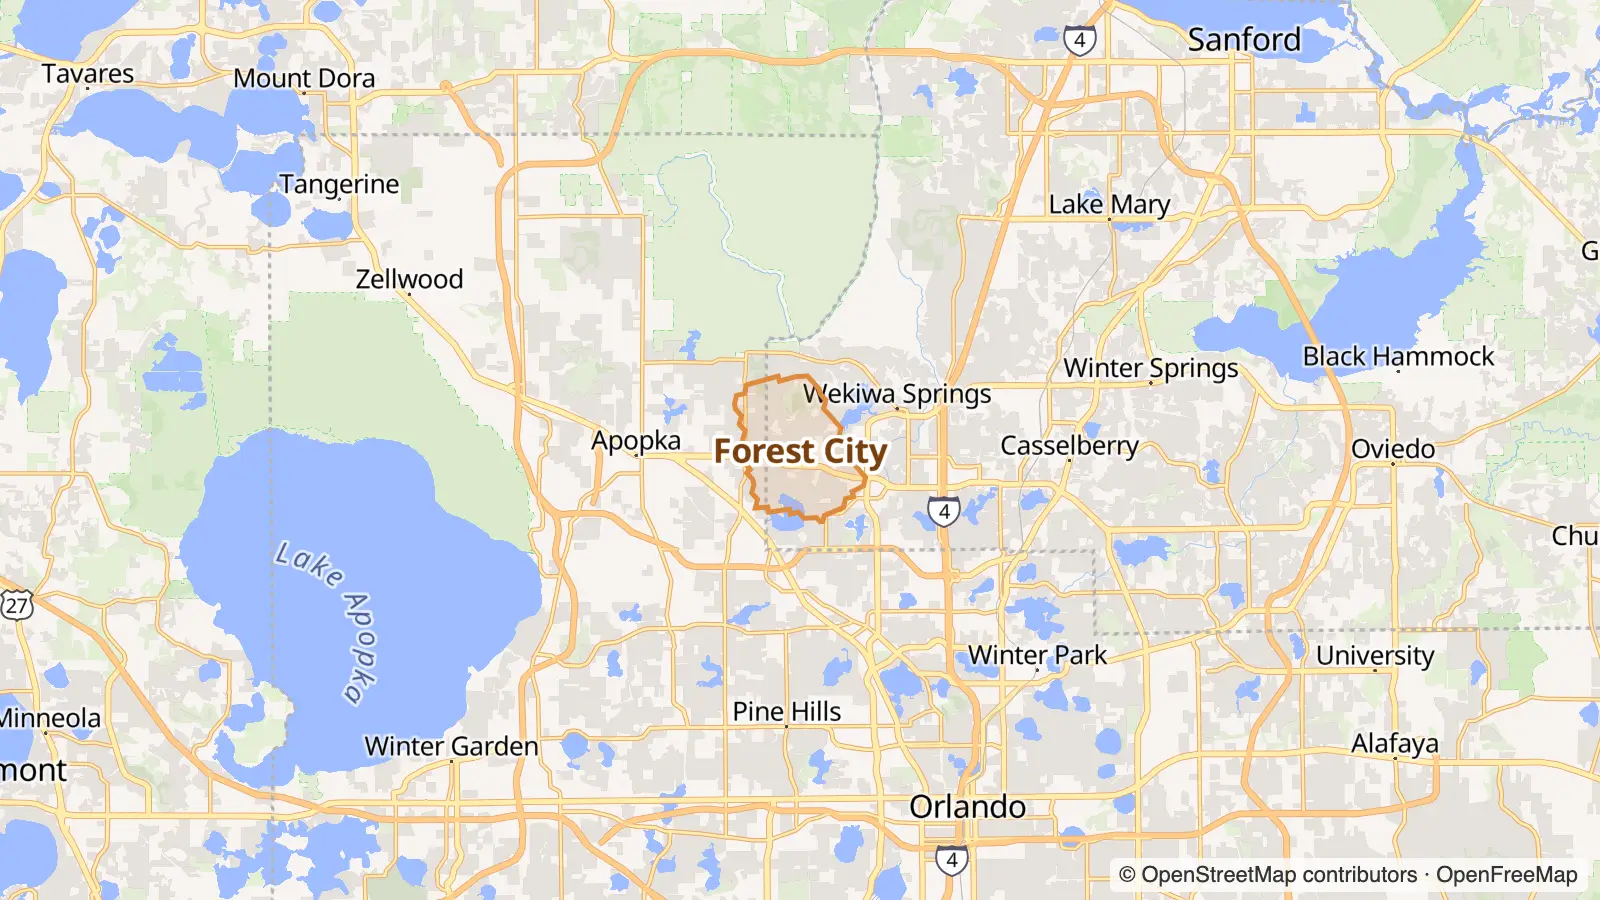
High incomes top 13% · top 10%Quiet streets top 5% · top 14%Mostly houses top 11% · top 11%Owner-occupiers top 17% · top 20%Older crowd top 22% · top 10%Parks & outdoors top 7% · top 2%Kid-friendly top 1% · top 8%
Matched on density, street life and geography, plus census data on income, rents, age, housing type, renting vs owning, birthplace, languages, jobs and household size.
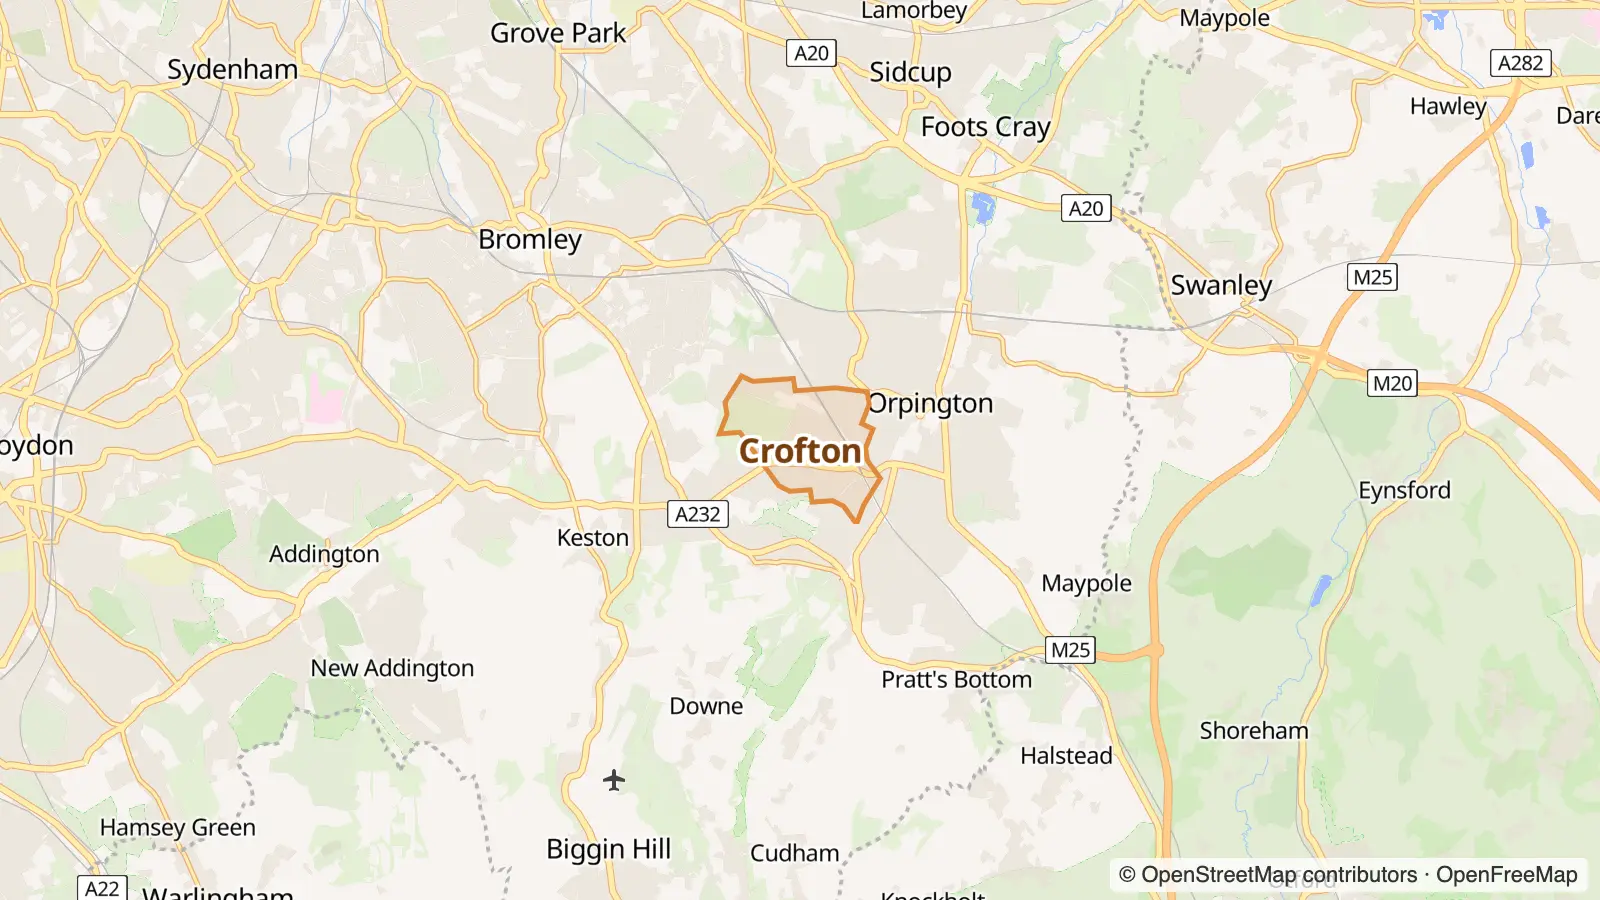
High incomes top 13% · top 4%Quiet streets top 5% · top 17%Owner-occupiers top 17% · top 4%Mostly houses top 11% · top 9%Mostly Aussie-born top 15% · top 12%Family suburb top 22% · top 22%Older crowd top 22% · top 22%Parks & outdoors top 7% · top 3%Kid-friendly top 1% · top 1%Visitor hub top 8% · top 7%
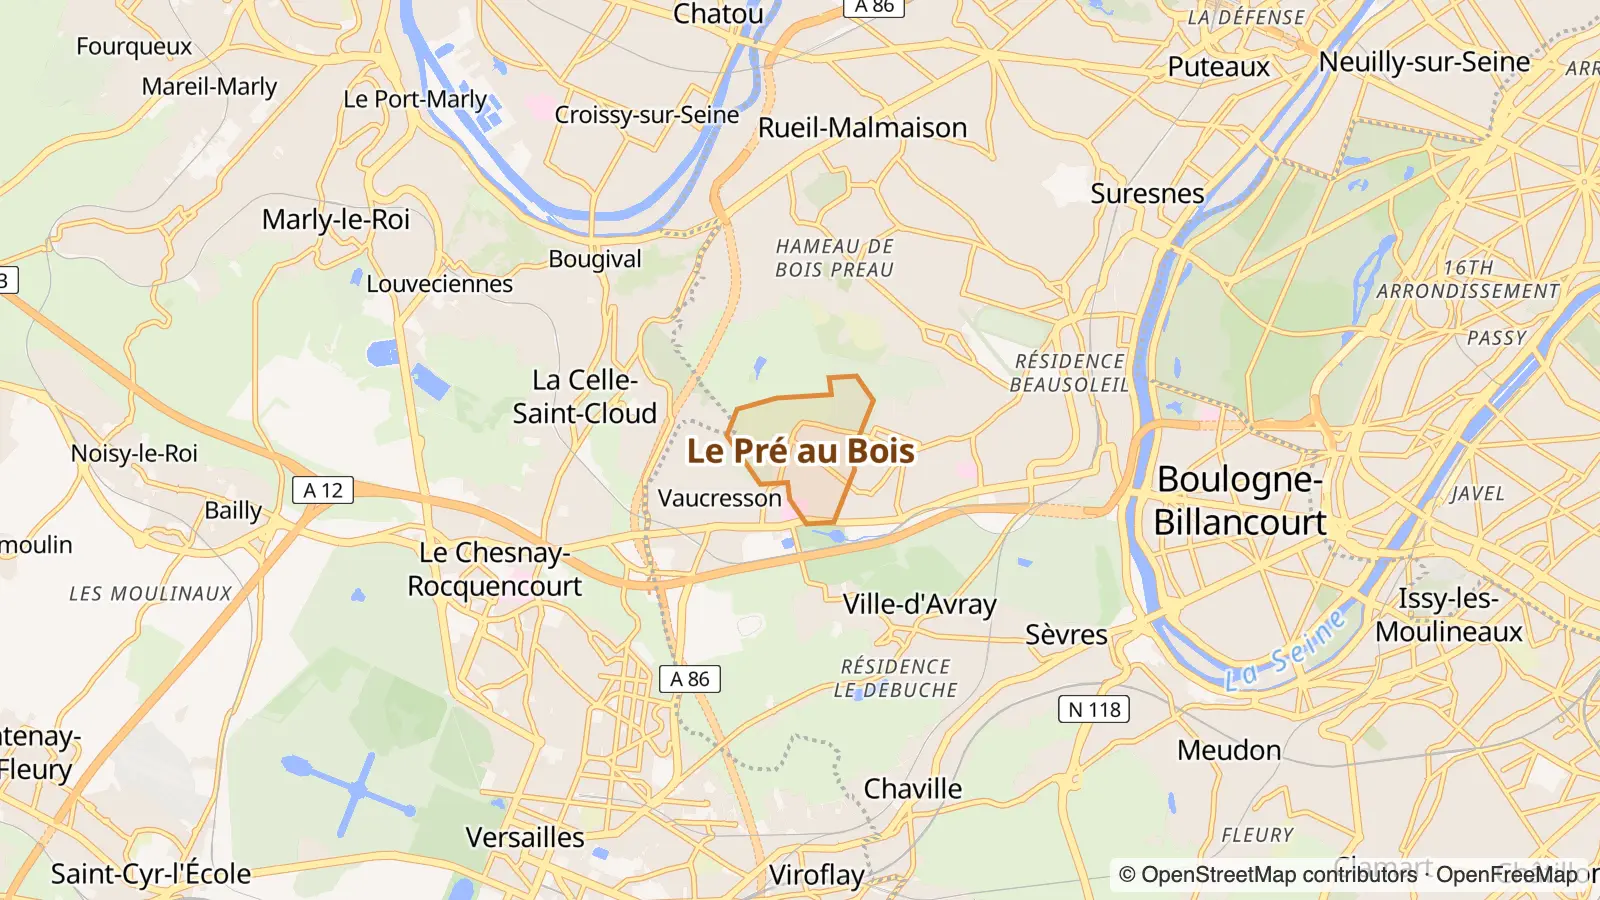
Quiet streets top 5% · top 15%High incomes top 13% · top 24%Owner-occupiers top 17% · top 4%Mostly houses top 11% · top 21%Older crowd top 22% · top 20%Parks & outdoors top 7% · top 7%
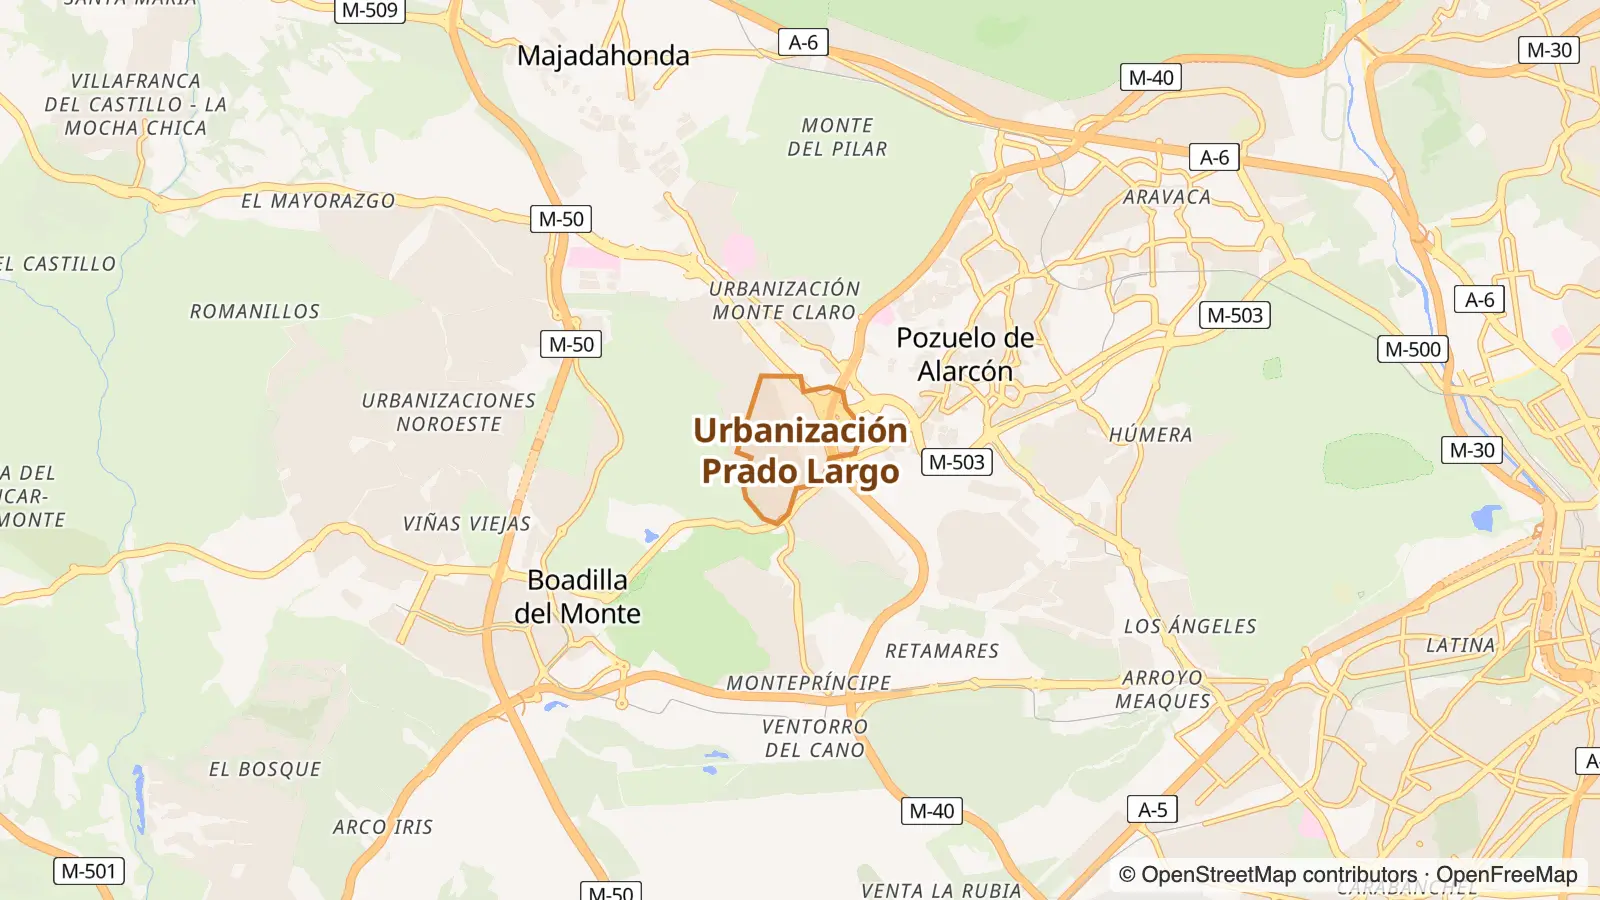
Quiet streets top 5% · top 9%High incomes top 13% · top 22%Owner-occupiers top 17% · top 3%Mostly houses top 11% · top 11%Mostly Aussie-born top 15% · top 14%Family suburb top 22% · top 12%Parks & outdoors top 7% · top 15%Visitor hub top 8% · top 9%Kid-friendly top 1% · top 17%Gyms & studios top 19% · top 20%
Quiet streets top 5% · top 24%Owner-occupiers top 17% · top 25%Mostly Aussie-born top 15% · top 21%Kid-friendly top 1% · top 1%Gyms & studios top 19% · top 16%
Quiet streets top 5% · top 20%Owner-occupiers top 17% · top 19%Mostly houses top 11% · top 20%Older crowd top 22% · top 23%Parks & outdoors top 7% · top 3%
Owner-occupiers top 17% · top 9%Mostly houses top 11% · top 5%Mostly Aussie-born top 15% · top 20%Family suburb top 22% · top 18%Visitor hub top 8% · top 20%
Matched on density, street life and geography, plus census data on income, rents, age, housing type, renting vs owning, birthplace, languages and household size.
High incomes top 13% · top 4%Quiet streets top 5% · top 7%Owner-occupiers top 17% · top 5%Mostly houses top 11% · top 3%Parks & outdoors top 7% · top 15%Kid-friendly top 1% · top 5%Visitor hub top 8% · top 22%
Quiet streets top 5% · top 20%Owner-occupiers top 17% · top 23%Mostly houses top 11% · top 17%Mostly Aussie-born top 15% · top 7%Older crowd top 22% · top 14%Visitor hub top 8% · top 5%
High incomes top 13% · top 4%Quiet streets top 5% · top 8%Owner-occupiers top 17% · top 6%Older crowd top 22% · top 18%Parks & outdoors top 7% · top 1%Gyms & studios top 19% · top 14%Visitor hub top 8% · top 20%
Matched on density, street life and geography, plus census data on income, rents, age, housing type, renting vs owning, birthplace, languages, jobs and household size.
Quiet streets top 5% · top 3%High incomes top 13% · top 2%Owner-occupiers top 17% · top 16%Mostly houses top 11% · top 5%Mostly Aussie-born top 15% · top 11%Family suburb top 22% · top 18%Older crowd top 22% · top 11%Parks & outdoors top 7% · top 7%Kid-friendly top 1% · top 12%
Quiet streets top 5% · top 3%Owner-occupiers top 17% · top 15%Mostly houses top 11% · top 8%Older crowd top 22% · top 2%Parks & outdoors top 7% · top 5%Kid-friendly top 1% · top 1%Visitor hub top 8% · top 11%
High incomes top 13% · top 20%Owner-occupiers top 17% · top 19%Mostly Aussie-born top 15% · top 2%Family suburb top 22% · top 22%Parks & outdoors top 7% · top 19%Gyms & studios top 19% · top 17%
Matched on density, street life and geography, plus census data on age, housing type, renting vs owning, birthplace, languages, jobs and household size.
Owner-occupiers top 17% · top 7%Mostly houses top 11% · top 10%Mostly Aussie-born top 15% · top 20%Visitor hub top 8% · top 5%Gyms & studios top 19% · top 16%
Quiet streets top 5% · top 4%High incomes top 13% · top 11%Owner-occupiers top 17% · top 5%Mostly Aussie-born top 15% · top 6%Mostly houses top 11% · top 24%Parks & outdoors top 7% · top 3%Kid-friendly top 1% · top 1%Gyms & studios top 19% · top 17%
Quiet streets top 5% · top 18%Parks & outdoors top 7% · top 14%Kid-friendly top 1% · top 13%Gyms & studios top 19% · top 8%Visitor hub top 8% · top 23%
Quiet streets top 5% · top 21%Mostly Aussie-born top 15% · top 11%Family suburb top 22% · top 21%Parks & outdoors top 7% · top 11%Gyms & studios top 19% · top 6%
Quiet streets top 5% · top 17%Mostly Aussie-born top 15% · top 6%Family suburb top 22% · top 23%Parks & outdoors top 7% · top 2%Visitor hub top 8% · top 13%Gyms & studios top 19% · top 23%
Quiet streets top 5% · top 3%Mostly Aussie-born top 15% · top 10%Parks & outdoors top 7% · top 1%Visitor hub top 8% · top 2%Gyms & studios top 19% · top 23%
Quiet streets top 5% · top 14%Mostly Aussie-born top 15% · top 7%Family suburb top 22% · top 8%Parks & outdoors top 7% · top 2%Kid-friendly top 1% · top 8%Gyms & studios top 19% · top 2%
Quiet streets top 5% · top 18%Mostly Aussie-born top 15% · top 7%Family suburb top 22% · top 22%Parks & outdoors top 7% · top 4%Kid-friendly top 1% · top 1%
Scores are 0–100. Every match uses Overture Maps places, population density and geography, plus whatever census data both countries publish (see each section). All are adjusted by visitor votes each time the data is refreshed.